Watch this preview to learn more about what to expect from this program and how it can transform your career.
Program Overview
Vantage Africa School of Leadership will be conducting a Certified Data Analysis & Visualization Training in Yaounde,Cameroon. This practical, hands-on, and comprehensive program is designed to equip participants with the critical analytical and visualization skills required to become Certified Data Analysis Professionals recognized across sectors.
Participants will gain in-depth, practical experience using leading tools SPSS, R, STATA, Power BI, and Tableau with all necessary software provided. You will learn how to collect, clean, analyze, and visualize data for effective decision-making and reporting.
After the physical, one-on-one training, learning will continue online for 3 months, meeting once a week in the evenings. Participants will receive ongoing mentorship and technical support to help them design effective data systems, launch consultancies, or advance their careers in data analytics.
Venue: Hotel La Sadornie, Yaounde
Total Cost: CFA 295,000 (Inclusive of):
1. Training and consultancy
2. Training materials
3. Meals for the three days
4. Three months of post-training support
5. Access to the e-learning platform for three months
6. Software for all training sessions
7. Certificate of Completion
Program Starts In
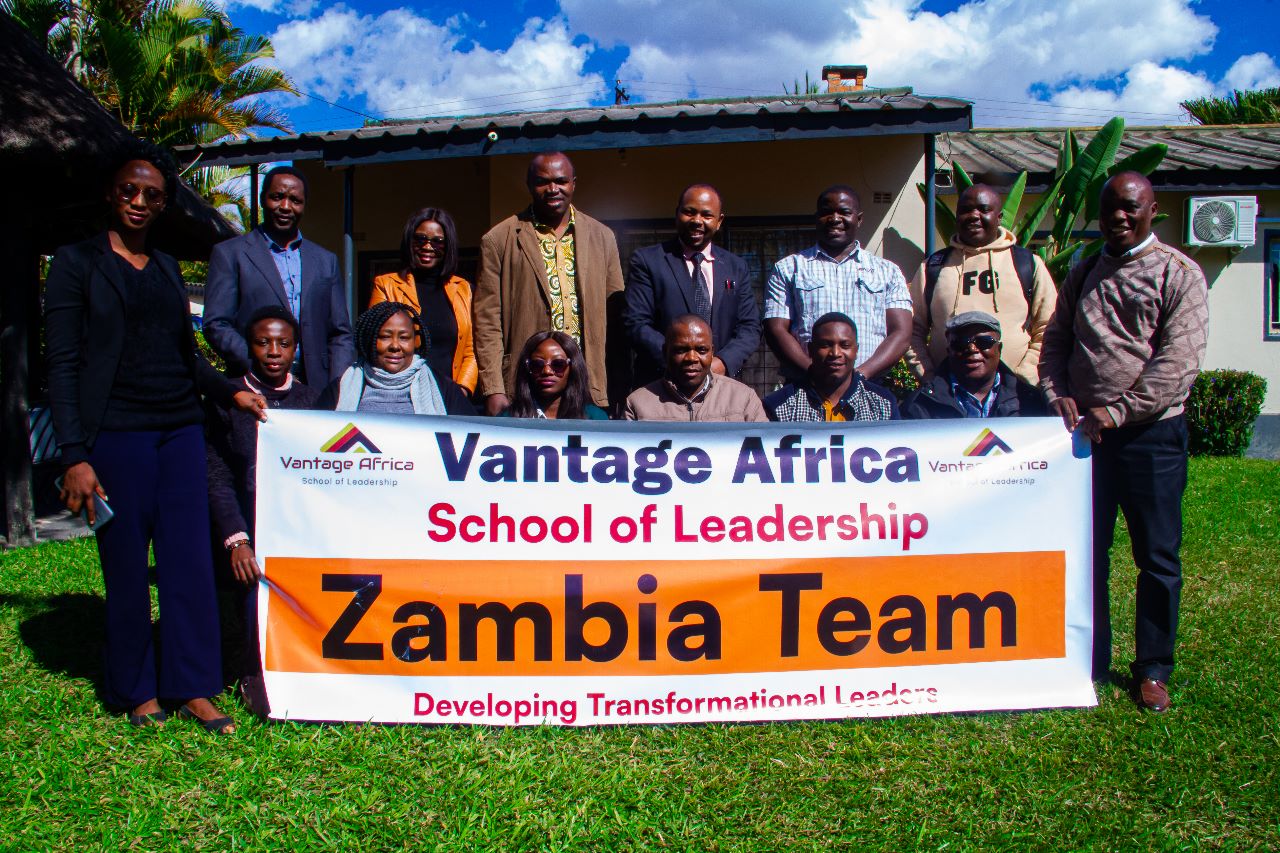
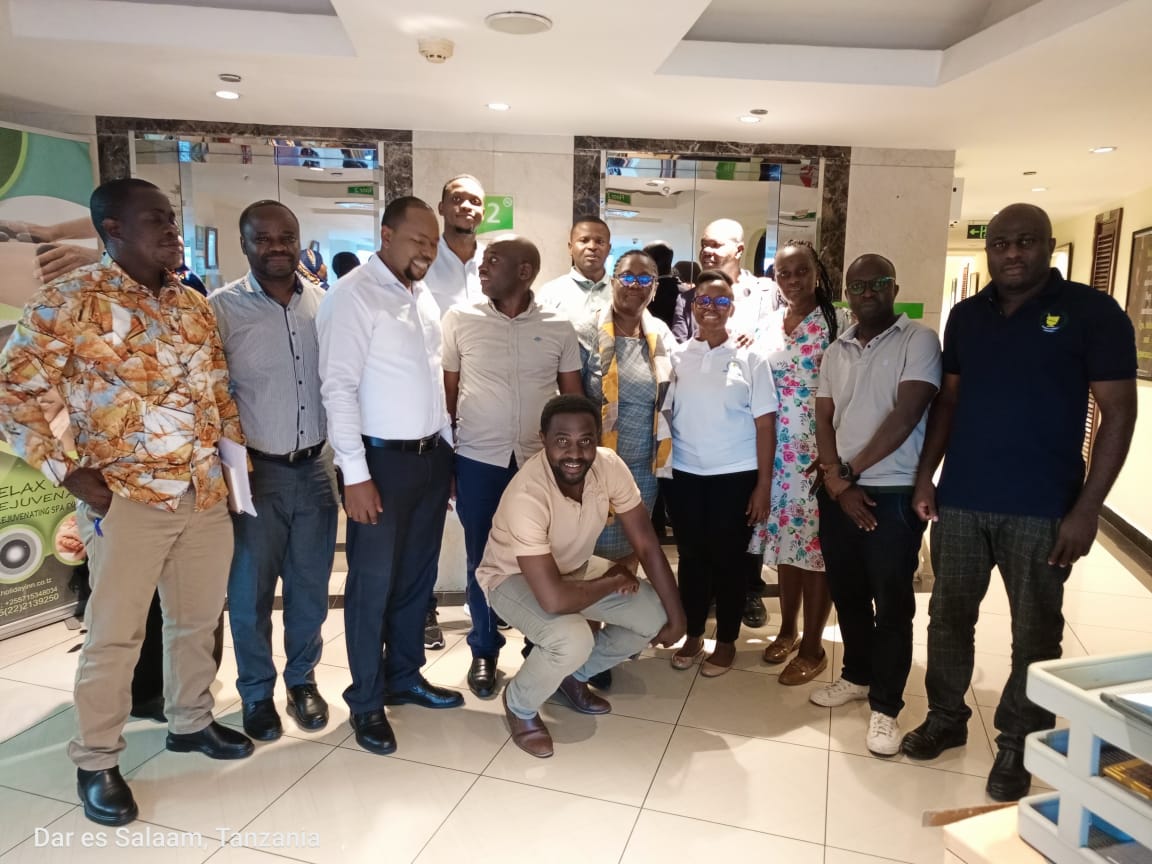
We Have Conducted Trainings in 28 Countries Across Africa
Here are some of them


Our Background and Expertise
Vantage Africa School of Leadership has positioned itself as a trusted training partner across Africa. We have trained over 10,000 professionals in 28 countries, walking alongside governments, NGOs and private sector organizations to strengthen their ability to design, monitor, and evaluate programs that deliver real impact.
Our Philosophy
At Vantage Africa, Statistical Package for the Social Sciences (SPSS) is taught as a competency-based tool rather than an academic concept. The focus is not on definitions, but on application. Certification is based on demonstrated proficiency participants must prove they can execute complete data analysis workflows using Statistical Package for the Social Sciences (SPSS). Facilitators act as mentors, ensuring that every learner develops analytical fluency and can apply Statistical Package for the Social Sciences (SPSS) outputs to real organizational problems
How We Conduct Our Data Analysis Trainings
(and why our methodology works)
Our Unique Approach
By the end of the programme, participants will: • Be proficient in managing and analyzing data using Statistical Package for the Social Sciences (SPSS). • Conduct descriptive and inferential analyses independently. • Interpret and report results in decision-making contexts. • Use Statistical Package for the Social Sciences (SPSS) to support evidence-based planning, evaluation, and research. • Demonstrate professional competence as Certified Statistical Package for the Social Sciences (SPSS) Analysts.
Understand the Foundations of Data Analysis
Participants begin by exploring the core principles of data analytics and its role in modern decision-making. They learn how data informs policy, business, and research outcomes while examining the strengths of tools like R, Python, STATA, Tableau, and Power BI. This session lays the groundwork for understanding data structures, data types, and the overall analytical workflow — from data collection to visualization and reporting.
Prepare and Clean Data for Analysis
Learners acquire hands-on skills in preparing and cleaning raw data, ensuring accuracy and consistency. They master techniques for handling missing values, duplicates, and outliers, as well as transforming and merging datasets across multiple formats. Practical sessions emphasize the use of R (tidyverse), Python (Pandas), and STATA commands for data cleaning, while introducing Power BI and Tableau Prep for visual data preparation.
Explore and Analyze Data
Participants engage in exploratory data analysis (EDA) — uncovering trends, patterns, and relationships in datasets. They learn to generate descriptive statistics, summarize data, and apply cross-tabulations to support evidence-based conclusions. The session includes creating visual summaries such as histograms, boxplots, and scatter plots using R, Python, and STATA, complemented by interactive visual analysis in Tableau and Power BI.
Apply Statistical and Predictive Models
At this stage, participants move into inferential and predictive analytics. They perform hypothesis testing, correlation, and regression analysis across different tools, comparing outputs and interpretations. Participants also explore the basics of predictive modeling — including linear and logistic regression — using Python (scikit-learn) and R (caret), and visualize their model outputs through Power BI and Tableau dashboards.
Build Insightful Dashboards and Demonstrate Competence
Each participant applies the concepts learned by building a real-world analytical dashboard. They integrate cleaned data, statistical results, and visuals into a cohesive story that communicates insights effectively to stakeholders. Learners develop interactive dashboards using Power BI and Tableau, integrating R and Python visuals where necessary, and conclude by presenting key findings and recommendations.
This approach has produced excellent professionals across the continent who do not just have "book knowledge", but can deliver results in the field.
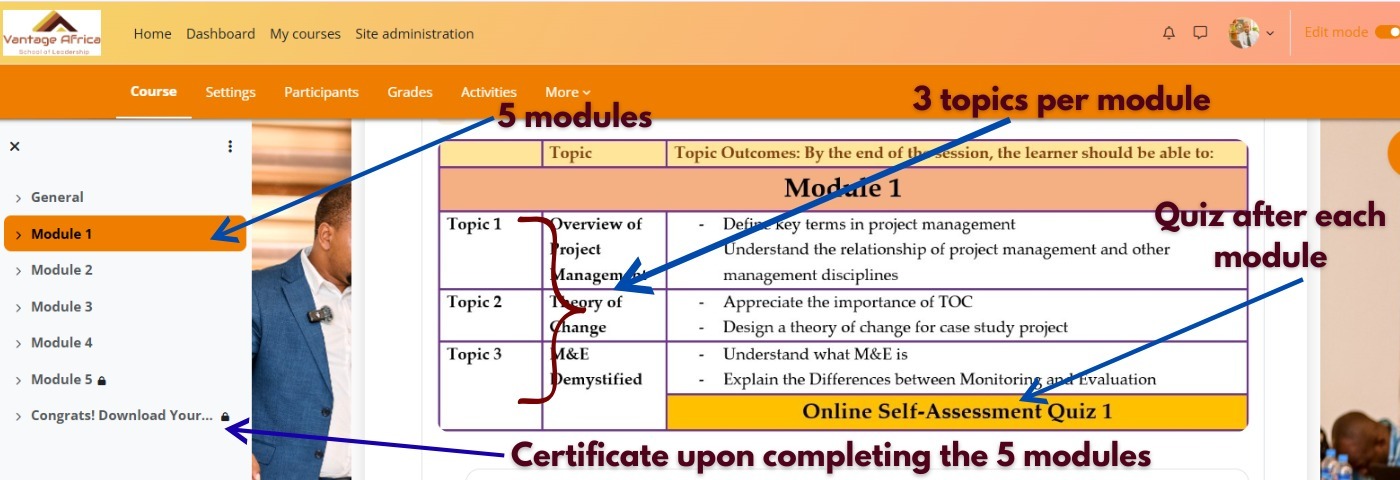
E-Learning Platform
General Look and Feel
Certificate: Verifiable Through QR Code From Anywhere
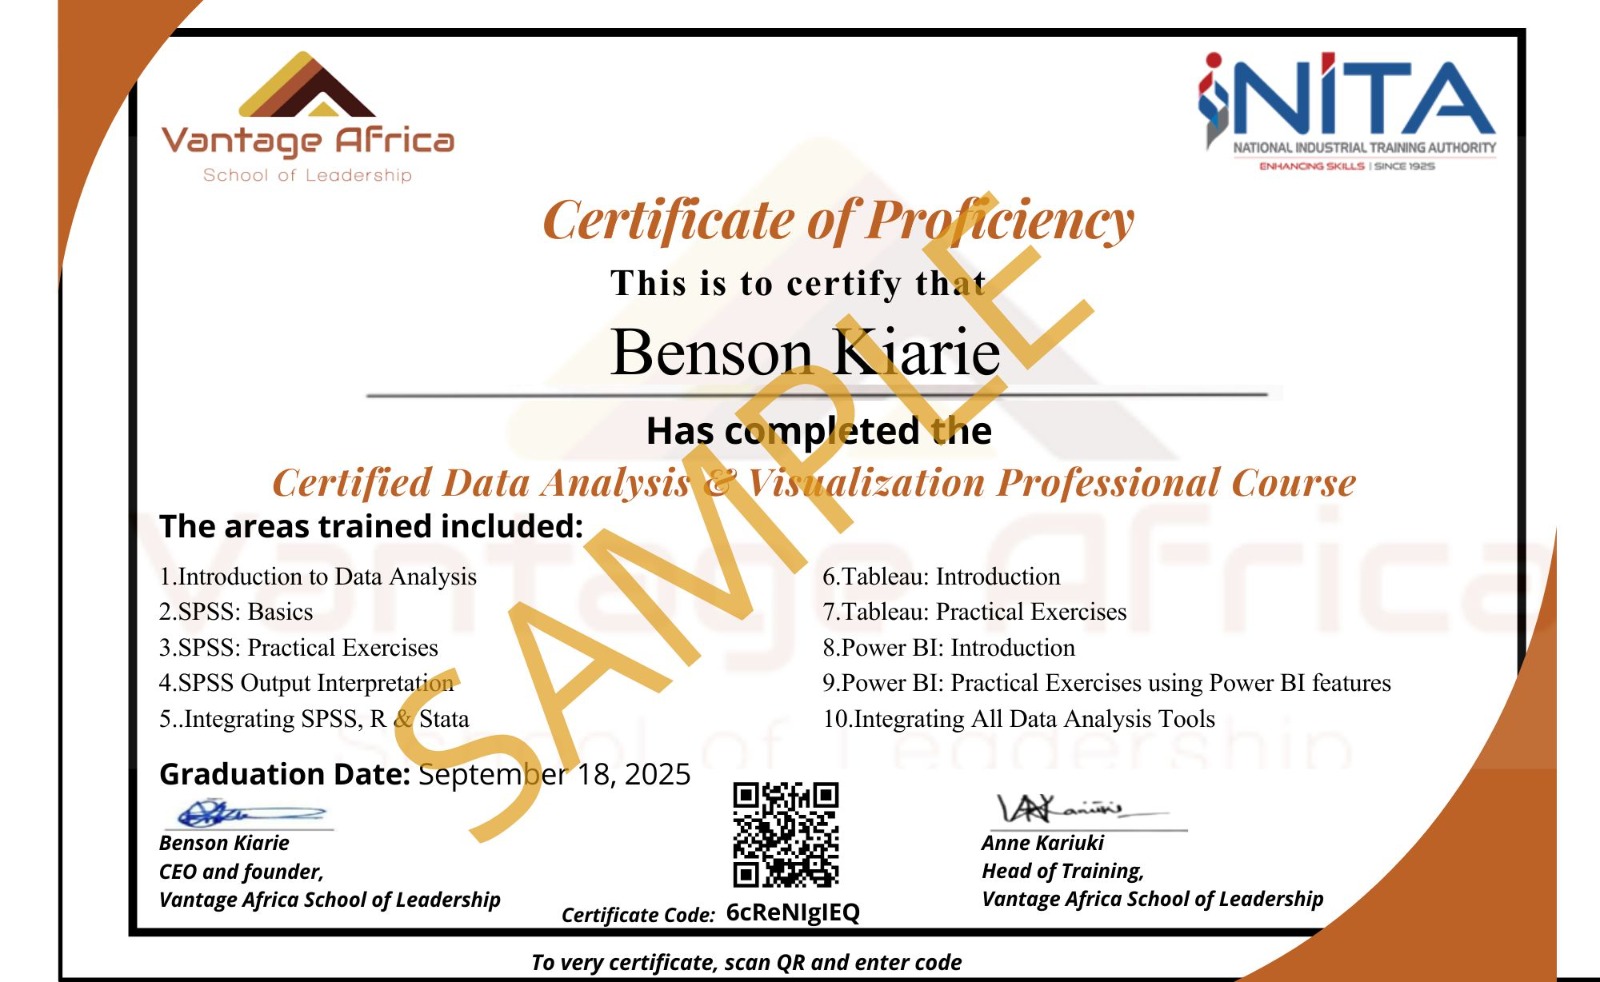
Our certificate demonstrates your competence in Data Analysis anywhere in the world. Join thousands of professionals who go beyond theory to master practical, hands-on skills in data cleaning, analysis, visualization, and evidence-based decision-making.
Each certificate includes a unique QR code that can be scanned to verify its authenticity instantly, ensuring your credentials are recognized globally.
Meet Your Lead Trainer
